Project Details
Year
2023
My Role
UI &UX Lead
Tools
Adobe XD, Devops, Luccidchart
Category
B2B SaaS WebApp
Product Overview
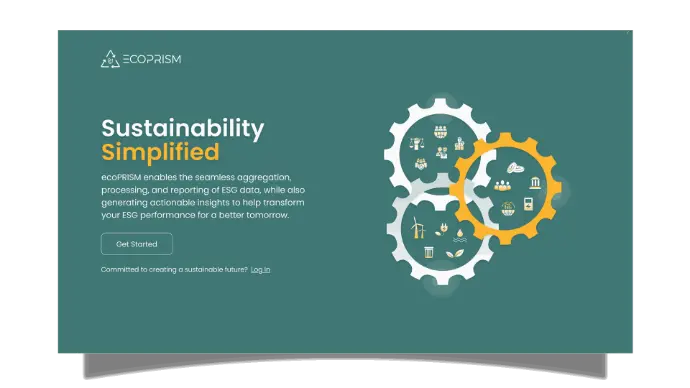
Ecoprism is an ESG (Environmental, Social, Governance) SaaS platform that simplifies compliance and sustainability reporting. My role was to translate research insights into intuitive UI and UX workflows, ensuring the product experience was clear, usable, and scalable.
My Role & Approach
UI/UX Design Lead: Owned the end-to-end visual and interaction design of the platform, including wireframing, prototyping, user flows, and high-fidelity interfaces.
Domain Learning: Though new to ESG, I rapidly onboarded regulatory knowledge and sustainability concepts by closely collaborating with in-house sustainability experts who led user research and interviews.
Cross-disciplinary Collaboration: Worked alongside compliance teams, engineers, and domain specialists to ensure accurate translation of complex regulatory logic (e.g., EU CSRD, India BRSR) into intuitive and accessible user experiences.
Challenges & Opportunities
Complex Workflows: ESG reporting involves multiple regulatory frameworks, numerous data inputs, and strict audit requirements. Simplifying these for diverse users was a significant design challenge.
Dynamic Compliance: The platform needed to support current frameworks and scale to new jurisdictions with configurable modules—necessitating flexible, modular UI components.
User Diversity: Interface had to accommodate expert sustainability officers and suppliers with limited ESG experience, requiring role-based adaptations and progressive disclosure.
Trust & Transparency: Given regulatory stakes, interfaces had to clearly communicate validation status, data provenance, and audit trails without overwhelming users.
Goals
Our goal was to help enterprises navigate fast-evolving ESG regulations and make informed sustainability decisions.
Goal 1
Enable rapid, accurate ESG compliance reporting globally.
Goal 2
Drive user adoption with clean, data-rich dashboards and workflows.
Goal 3
Facilitate supplier participation and regional regulatory adaptation.
User Research
To ensure depth and objectivity, the interviews were led by an expert research team, enabling us to uncover:
Finding 1
Users struggled to track and align with varying regulatory requirements across jurisdictions.
Finding 2
Manual data gathering from suppliers caused bottlenecks and inconsistent submissions.
Finding 3
Most found existing ESG tools visually cluttered and unintuitive for ongoing reporting.
User Surveys
A targeted survey of ESG and procurement specialists validated workflow pain points, dashboard needs, and integrations, shaping adaptable modules and supplier management workflows.
Insight 1
88%
Prioritized real-time regulatory updates within the platform.
Insight 2
76%
Wanted customizable dashboards for different reporting needs.
Insight 3
62%
Struggled with cross-team supplier data coordination.
Design Process
1
Workshops & Sprints
Collaborated with sustainability experts to scope compliance workflows, pain points, and user priorities.
2
Wireframes & Prototypes
Focused on modular dashboards, onboarding wizards, dynamic reporting, and supplier survey forms.
3
Iterative Testing
Continuous improvement through expert-driven feedback loops, ensuring clarity, trust, and auditability.
Design Solutions
Modular Dashboards
Provided role-specific KPIs and compliance status at a glance, customizable across geographies.
Onboarding Wizards
Guided users through complex configuration and data mapping tasks with stepwise instructions and error validation.
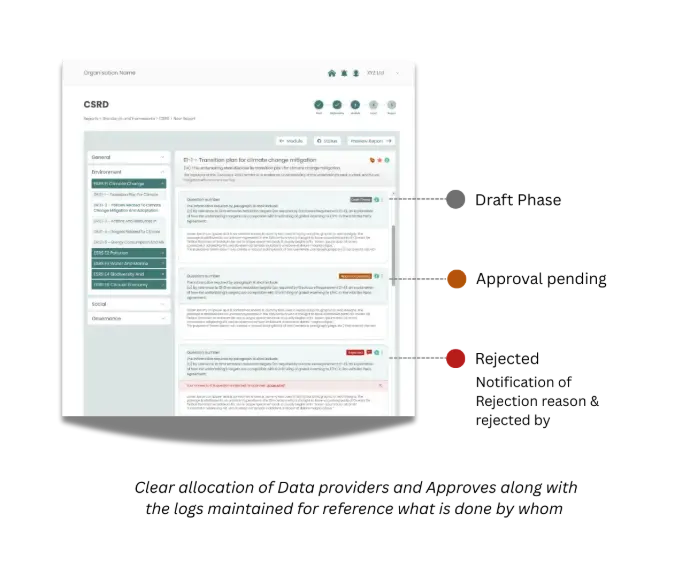
Regulatory Reporting Flows
Dynamic forms that generate CSRD-compliant reports, with in-built audit trails and version control.
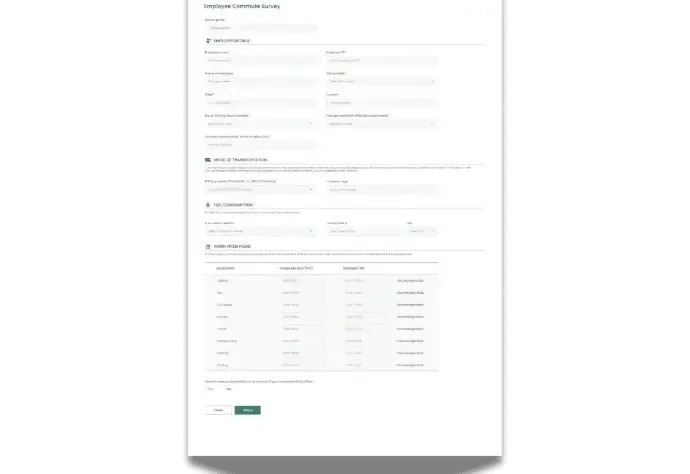
Supplier Engagement
Multi-language surveys with real-time tracking to facilitate upstream data collection without burdensome processes.
Brand Guidelines
Defined core colors (#407775 deep teal, #fab430 vivid yellow) and Poppins font to ensure visual consistency and clarity.
Design System Foundation
Created a reusable component library and styling rules based on brand guidelines for scalable and cohesive design.
Sneak peak of UI solution
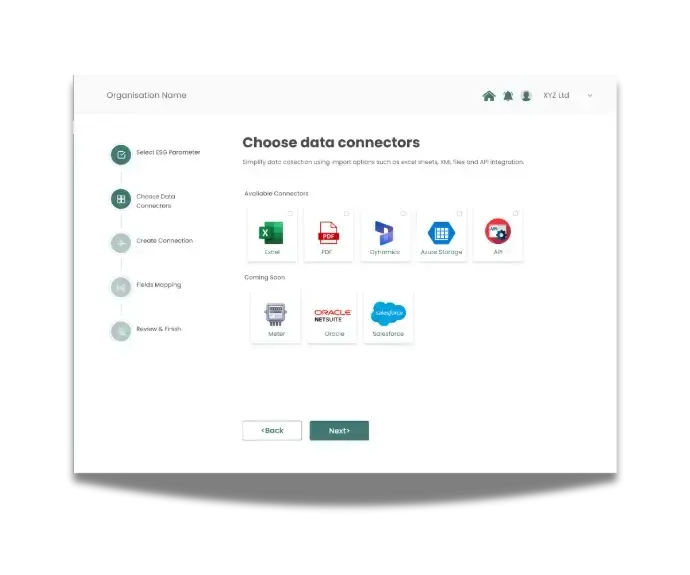
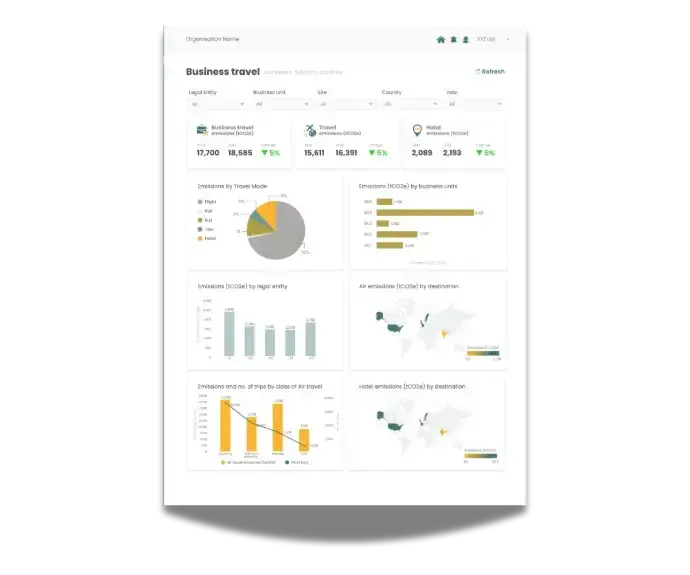

1. Fragmented Data
Problem
Fragmented compliance data made it hard to get an overview or analyze trends.
Solution
- Introduced connectors to import data from a single source in Phase 1.
- Expanded to multiple connectors in Phase 2 to integrate Excel, PDF, and other formats.
Result:
Users can now access and analyze ESG data 30% faster than before
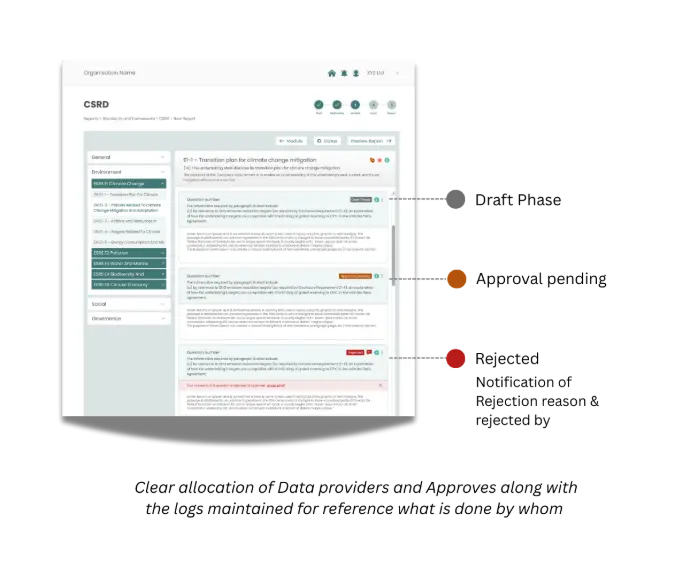
2. Streamlining CSRD Reporting
Problem
CSRD reporting required extensive manual effort and coordination.
Solution
- Integrated AI-assisted answers to suggest responses for reporting questions.
- Enabled team-based assignment with verification and alert notifications.
Result:
Reporting time reduced by 40%, error rate dropped by 30%
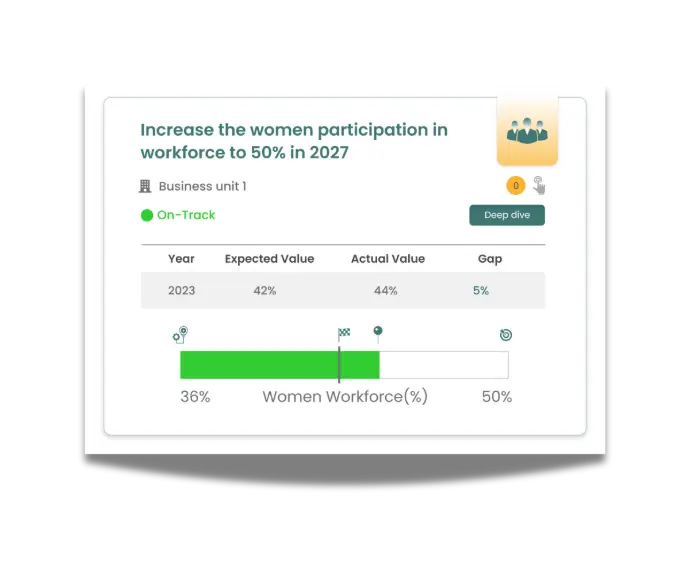
3. Emission Reduction Strategy Tracking
Problem
Companies struggled to strategically plan emission reduction goals.
Solution
- Built a target-tracking dashboard to set goals and monitor progress.
- Visualized current value, target, % progress, milestones, and allowed deep dives.
Result:
Users could track goals and milestones. 90% of targets tracked without manual follow-up
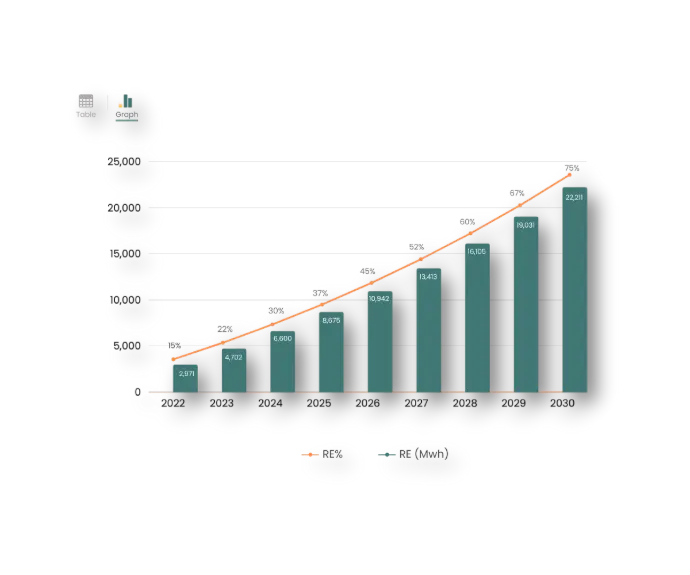
4. Current Scenario & Future Growth Analysis
Problem
Assessing the current scenario and projecting future growth was unclear.
Solution
- Allowed users to input current and target metrics; system calculated annual growth rates.
Result:
Users gained clear visibility. 95% of pilots reported better strategic planning
Key Takeaways
"Designing for a new, regulation-heavy domain taught me the importance of working with domain experts and keeping the UI lightweight. "
Impact & Outcomes
89%
Task Completion Rate4.6/5
User Satisfaction
57%
Supplier Survey Response
<2%
Compliance Error Rate
Conclusion
ecoPRISM illustrates a successful journey of domain learning, interdisciplinary collaboration, and design leadership in ESG software. The project reflects how thoughtful product design can turn complexity into clarity, driving adoption and impact in emerging sustainability markets.